Key injury statistics

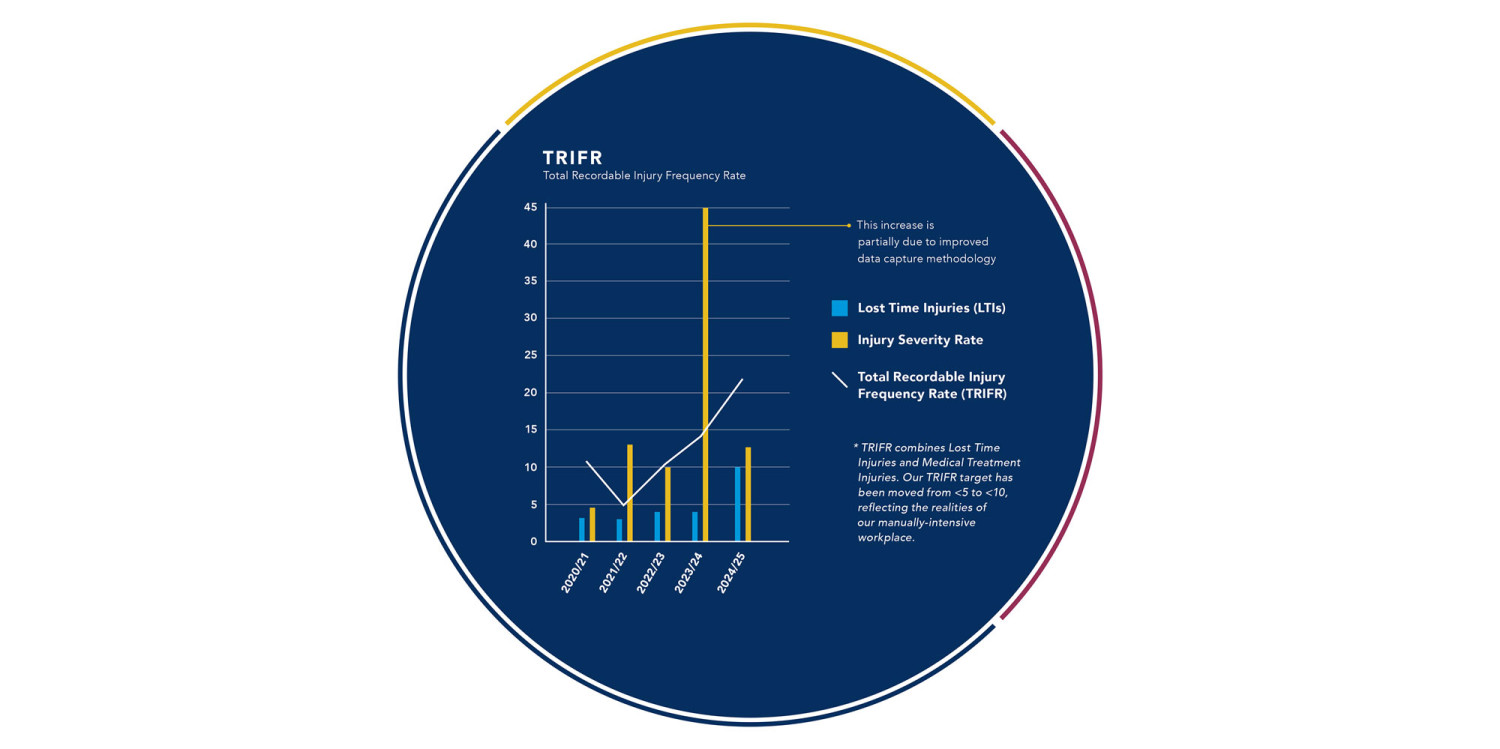
The graph shows our three key injury statistics, including the overarching Total Recordable Injury Frequency Rate (TRIFR), which combines Lost Time Injuries and Medical Treatment Injuries. Our Statement of Corporate Intent (SCI) targets a TRIFR of less than 10. During the past year, we achieved a rate of 22, 60% up on the previous year.
Head of Safety Ross Buchan says the increase is not attributable to one common factor. “Lost Time Injuries (LTIs) have doubled compared to last year, because we’ve had a strong focus on reporting injuries and actioning appropriate treatment. Most of the 10 injuries related to muscular-skeletal pain or injury caused through either ergonomic factors of work tasks, or accepted ‘slip, trip, fall risk’ on level surfaces or work areas.*
“Positively, the Injury Severity Rate was 72% less than last year. This was due to two reasons. Some of our LTI injuries were very minor in nature and only required a day or two off work. Our improved injury management practices over 2024/25 also had a positive impact.”
Injury management improved
We appointed a dedicated Injury Support Coordinator to help kaimahi and supervisors through the injury management process.
Ross: “With this role in place, we have developed a complete injury management pack that injured kaimahi take with them to medical providers. These packs include information for kaimahi on the process of managing an injury, what to expect from ACC and documents to support doctors making informed decisions around alternative or light duties to keep people at work during recovery.”
Average days taken to return our kaimahi to work after a work-related injury have dropped from 22.5 days in July 2024, to 12.9 days by June 2025.
Safety-related observations
In the past year, we focused on getting our leaders out in the workplace more regularly to observe how tasks are performed and engage with our kaimahi on challenges they face.
Conducting these Visual Safety Leadership conversations is an SCI metric, with a target of 1000 observations annually. Last financial year, we were well short, at only 792 observations. This year, we reached 953 – a 20% increase.
*For example, a twisted ankle on the wharf’s crane rail

