Sustainability
One of our six Integrated Reporting capitals is “Our harbour taoka and beyond”. The goals within this capital (Integrated Report 2026) are:
- Execute our climate change plan covering climate change risk assessment, adaptation/mitigation strategies, reporting framework and current baseline.
- Preserve our beautiful harbour and its biodiversity by listening to our community and iwi, taking care and monitoring these precious taoka closely.
- Reduce our noise.
Reducing our carbon emissions: Strategy to 2030
Our always open strategy includes steps to reduce our climate change risk. A significant action is transitioning Port Chalmers Container Terminal mobile plant to electric, as technology allows. Currently, 99% of our mobile plant is powered by diesel fuel.
Port Otago is adopting three approaches to transition away from fossil fuels and reduce carbon emissions.
1. Operational efficiency
Small, incremental changes, cumulatively, do make a significant difference. This approach focuses on continuous improvements that eliminate waste. This includes waste of resources, such as diesel and labour, and wasting assets through inefficient operations.
2. Technology change
Port Otago’s asset management plan is central to achieving the company’s climate change goals, particularly now the climate adaptation plan and decarbonisation roadmap are incorporated into the plan.
The container terminal’s fleet of 14 straddle carriers is the company’s top contributor of carbon emissions at 1669 tCO2e per annum, accounting for 21% of emissions. In September 2026, Port Otago announced it was investing $28 million in 10 new Konecranes Noell hybrid straddle carriers. These will replace 10 diesel machines, when they arrive in August 2027.
3. Supply chain efficiency
This approach focuses on eliminating waste in the supply chain. While much of the supply chain is outside of our control, waste reductions are possible through the consolidation and co-location of contiguous processes. For instance, warehousing, mode hubs and container depots. We can also make a difference by enabling more fuel-efficient transport modes, such as helping customers transition from road to rail.
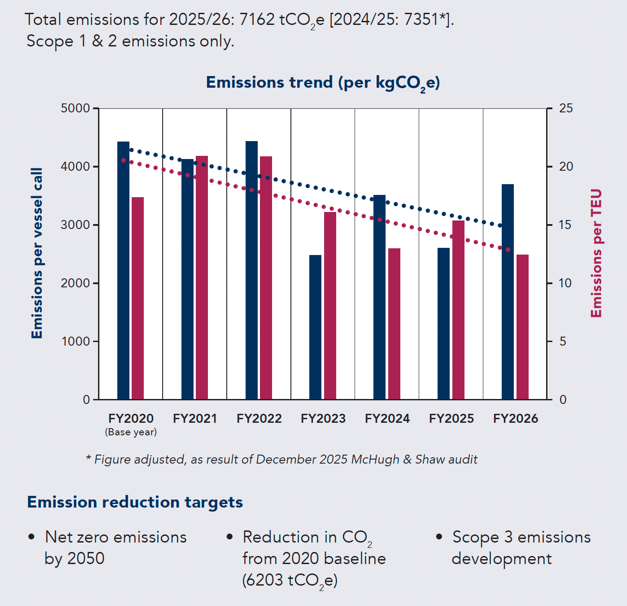
Emissions summary
The following graph shows an important metric: Total emissions (maroon bars) = tonnes of CO2e.
CO2e stands for “carbon dioxide equivalent”. It is a single unit that accounts for all greenhouse gases, including carbon dioxide, methane and nitrous oxide.